
Keeping an eye on CentOS performance with Grafana
I’ve spent a bit of time setting up CentOS as a home router due to a number of frustrations with existing home routers on the market. This was both a good exercise and a bit of nostalgia from my early days with Linux. Once I’d finished getting the basics set up, I wanted a way to track various statistics. Network traffic, disk usage, etc. The venerable cacti is certainly an option, but that’s feeling a bit legacy these days. I’d prefer to use a newer tool with a more modern feel. This is what led me to Grafana. Below is a basic walkthrough for how I’ve set things up. This is a very basic install, that incorporates Collectd, influxdb, and Grafana all on the same host.
Collectd
What, you thought I’d jump straight into Grafana? We have to have data to collect first, and the best way to do that on CentOS is via collectd
The simplest way to get collectd on CentOS is via the EPEL repository. If you’re new to CentOS, or aren’t familiar with the Fedora’s EPEL repo, the command below is all you need to get started.
yum install epel-release
Now that the EPEL repo is enabled, it’s easy enough to install collectd in the same manner:
yum install collectd
There are a number of additional collectd plugins available in EPEL, but for our purposes here the base is enough. I would encourage you to explore the available plugins if your needs aren’t met by the base plugin.
Now that it’s installed, we need to configure collectd to send data out. Collectd generates the stats, but we need to put it someplace that Grafana can use.
In /etc/collectd.conf there are a few things we need to configure. In the
Global section, uncomment the lines for Hostname, BaseDir, PIDFile,
PluginDir, and TypesDB. You’ll need to modify Hostname, but the rest
should be fine as the defaults. It should look something like the snippet
below:
Hostname    "YourHostNameHere"
#FQDNLookup   true
BaseDir     "/var/lib/collectd"
PIDFile     "/var/run/collectd.pid"
PluginDir   "/usr/lib64/collectd"
TypesDB     "/usr/share/collectd/types.db"
Now that we have the basic app information set, we need to enable the plugins
we wish to use. For my instance, I have syslog, cpu, disk, interface,
load, memory, and network uncommented. Of these, the default values are
fine for everything except network. The network plugin is used to send data
to our collector, which in this case is
influxdb. The network plugin will need to point
to your influxdb server. Since we’re doing everything locally in this example,
we’re pointing to localhost. It should look like the following:
<Plugin network>
  Server "127.0.0.1" "8096"
</Plugin>
InfluxDB
Now that we’re done with Collectd, we have to configure influxdb to pull in the data collectd is generating. Since influxdb isn’t in EPEL, we’ll have to pull this in from their repository. The command below makes it easy.
cat <<EOF > /etc/yum.repos.d/influxdb.repo
[influxdb]
name = InfluxDB Repository - RHEL \$releasever
baseurl = https://repos.influxdata.com/centos/\$releasever/\$basearch/stable
enabled = 1
gpgcheck = 1
gpgkey = https://repos.influxdata.com/influxdb.key
EOF
Once that’s done, install the package with yum install influxdb and
then it’s ready to configure. There are only a few things that need to happen
in the /etc/influxdb/influxdb.conf config file.
In the [http] section of your /etc/influxdb/influxdb.conf, set
enabled = true, and bind-address = ":8096". It should look like
this:
[http]
  # Determines whether HTTP endpoint is enabled.
enabled = true

  # The bind address used by the HTTP service.
bind-address = ":8086"
Then scroll down to the [[collectd]] section and configure it like the section below:
[[collectd]]
  enabled = true
  bind-address = ":8096"
  database = "collectd"
  typesdb = "/usr/share/collectd"
At this point we can go ahead and start both services to ensure that they’re working properly. To begin, we’ll enable collectd, and ensure that it’s sending data. As with other services, we’ll use systemd for this. In the sample below, you’ll see the commands used, and the output of a running collectd daemon.
[jperrin@monitor ~]$ sudo systemctl enable collectd
[jperrin@monitor ~]$ sudo systemctl start collectd
[jperrin@monitor ~]$ sudo systemctl status collectd
● collectd.service - Collectd statistics daemon
   Loaded: loaded (/usr/lib/systemd/system/collectd.service; enabled; vendor preset: disabled)
   Active: active (running) since Sat 2017-08-02 11:22:18 PDT; 6min ago
     Docs: man:collectd(1)
           man:collectd.conf(5)
 Main PID: 18366 (collectd)
   CGroup: /system.slice/collectd.service
           └─18366 /usr/sbin/collectd

Aug 2 11:22:18 monitor collectd[18366]: plugin_load: plugin "disk" successfully loaded.
Aug 2 11:22:18 monitor collectd[18366]: plugin_load: plugin "interface" successfully loaded.
Aug 2 11:22:18 monitor collectd[18366]: plugin_load: plugin "load" successfully loaded.
Aug 2 11:22:18 monitor collectd[18366]: plugin_load: plugin "memory" successfully loaded.
Aug 2 11:22:18 monitor collectd[18366]: plugin_load: plugin "network" successfully loaded.
Aug 2 11:22:18 monitor collectd[18366]: Systemd detected, trying to signal readyness.
Aug 2 11:22:18 monitor collectd[18366]: Initialization complete, entering read-loop.
Aug 2 11:22:18 monitor systemd[1]: Started Collectd statistics daemon.
Now that collectd is working, start up InfluxDB and make sure it’s gathering data from collectd.
[jperrin@monitor ~]$ sudo systemctl enable influxdb
[jperrin@monitor ~]$ sudo systemctl start influxdb
[jperrin@monitor ~]$ sudo systemctl status influxdb
● influxdb.service - InfluxDB is an open-source, distributed, time series database
   Loaded: loaded (/usr/lib/systemd/system/influxdb.service; enabled; vendor preset: disabled)
   Active: active (running) since Sat 2017-07-29 18:28:20 PDT; 1 weeks 6 days ago
     Docs: https://docs.influxdata.com/influxdb/
 Main PID: 23459 (influxd)
   CGroup: /system.slice/influxdb.service
           └─23459 /usr/bin/influxd -config /etc/influxdb/influxdb.conf

Aug 2 10:35:10 monitor influxd[23459]: [I] 2017-08-12T17:35:10Z SELECT mean(value) FROM collectd.autogen.cpu_value WHERE host =~ /^monitor$/ AND type_instance = 'interrupt' AND time > 417367h GR...) service=query
Aug 2 10:35:10 monitor influxd[23459]: [httpd] 172.20.1.40, 172.20.1.40,::1 - - [12/Aug/2017:10:35:10 -0700] "GET /query?db=collectd&epoch=ms&q=SELECT+mean%28%22value%22%29+FROM+%22load_shortte...ean%28%22value%
Aug 2 10:35:10 monitor influxd[23459]: [I] 2017-08-02T17:35:10Z SELECT mean(value) FROM collectd.autogen.cpu_value WHERE host =~ /^monitor$/ AND type_instance = 'nice' AND time > 417367h GROUP B...) service=query
As we can see in the output above, the service is working, and the data is being collected. From here, the only thing left to do is present it via Grafana.
Grafana
To install Grafana, we’ll create another repository as we did with InfluxDB. Unfortunately the Grafana folks don’t keep release versions separate in the repo, so this looks like we’re using an EL6 repo despite doing this work on EL7.
cat <<EOF > /etc/yum.repos.d/grafana.repo
[grafana]
name=grafana
baseurl=https://packagecloud.io/grafana/stable/el/6/$basearch
repo_gpgcheck=1
enabled=1
gpgcheck=1
gpgkey=https://packagecloud.io/gpg.key https://grafanarel.s3.amazonaws.com/RPM-GPG-KEY-grafana
sslverify=1
sslcacert=/etc/pki/tls/certs/ca-bundle.crt
EOF
Now that the repository is in place and enabled, we can install grafana the
same as the rest, yum install grafana. Once this is done, we can start
working on the configuration. For this tutorial, we’re just going to set an
admin username and password, because we’re doing this for a tutorial, and a
single user instance. I would absolutely encourage you to read the docs if you
want to start doing a bit more with grafana.
To accomplish this reasonably basic configuration, simply uncomment the
admin_user and admin_password lines in the [security] section of /etc/grafana/grafana.ini, and set your own values.
In this instance I’m using admin/admin, because that’s what you do in
examples, right?
[security]
# default admin user, created on startup
admin_user = admin

# default admin password, can be changed before first start of grafana,  or in profile settings
admin_password = admin
Now you can start grafana with systemctl start grafana-server, and configure
it via the web interface. After you log in for the first time, you’ll be
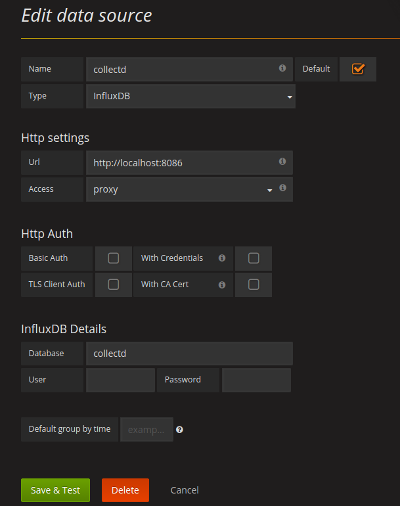
prompted to configure a few things including a data source, and a dashboard.
Since we’re doing this all on the localhost, you’ll be able to cheat and use
the data source settings in the screenshot. Don’t worry, we’re nearly there
and there’s only a little left to do.
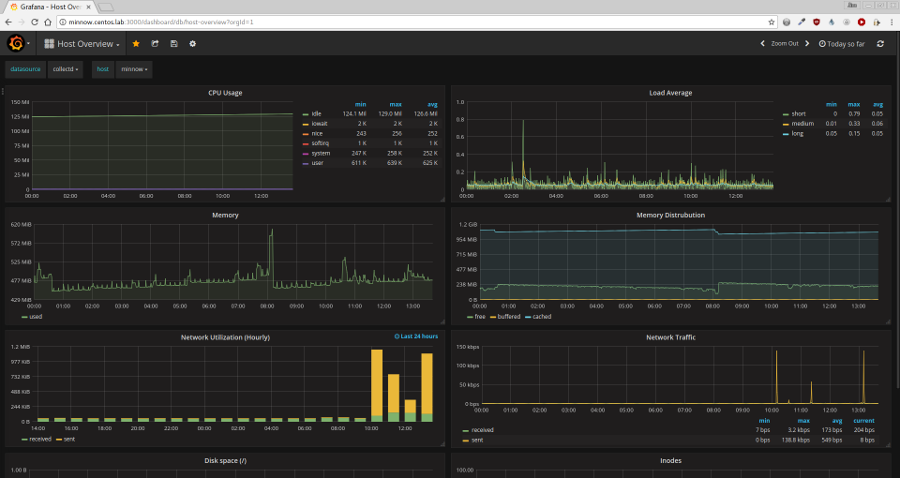
Once you have the datasource configured, you’ll be prompted to create your first dashboard. While you can certainly do this, it’s a little intimidating for a first run with grafana. One easy solution to this is to import one of the available templates offered on Grafana’s website. In my case, I opted to use the Host Overview. It provides a nice group of metrics and graphs as a base to use and build from.
Once you’ve gotten everything set up, it’s now down to personal preference and further tinkering. Once again I would very much recommend reading the documentation because there are a wealth of options and changes I didn’t touch on for this intro.